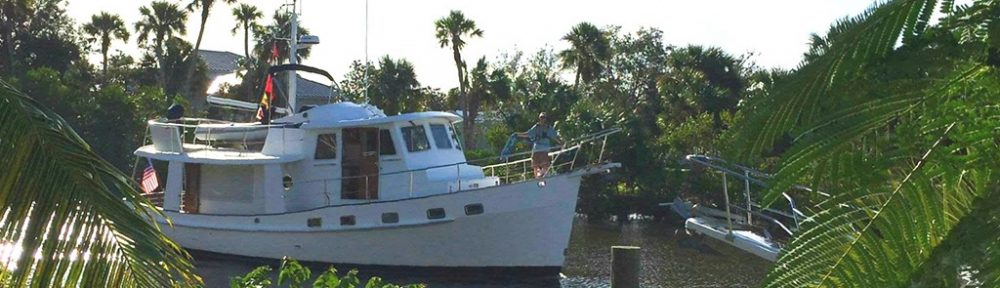
Vessel: Magnolia is a classic 42′ Kadey Krogen trawler with stabilizers, hydraulic bow thruster, hydraulic bow and stern anchor windlass. She is recreational vessel built to commercial like standards from her Lugger main-engine to her extensive hydraulics and redundancy provided by her 16Kw Lugger powered Northern Lights generator.
Background: Coincidentally when Magnolia’s solar array system was upgraded in 2019, a new data exchange format was emerging called Signal-K. Being ever curious, an idea of an in-depth data collection system came into focus. Research, along with a lot of trial and error, I got a Signal-K (http://signalk.org/ ) Server running on a RaspberryPi. (Before this started I did not even know what a RaspberryPi was.) After getting the server to receive Magnolia’s Raymarine Navigation Data via an Actisense USB Adapter, it was time to figure out how to get a “home-grown” sensor and Magnolia’s data into the server.
I wanted to build my own sensors and research led me to an Arduino processor board specifically, the Mega2560. I made this initial decision based on the large number of hardware inputs at the 5 volt level. The downside of this choice was there was no integrated Wifi. An ESP8266 chip with Wifi capability could be integrated using the serial interface. In the end I found the Mega2650 was not a great choice because I could not get good reliability from the Wifi nor solid interfaces from NTP Time Server. This is probably not the fault of the board but inexperience of the developer.
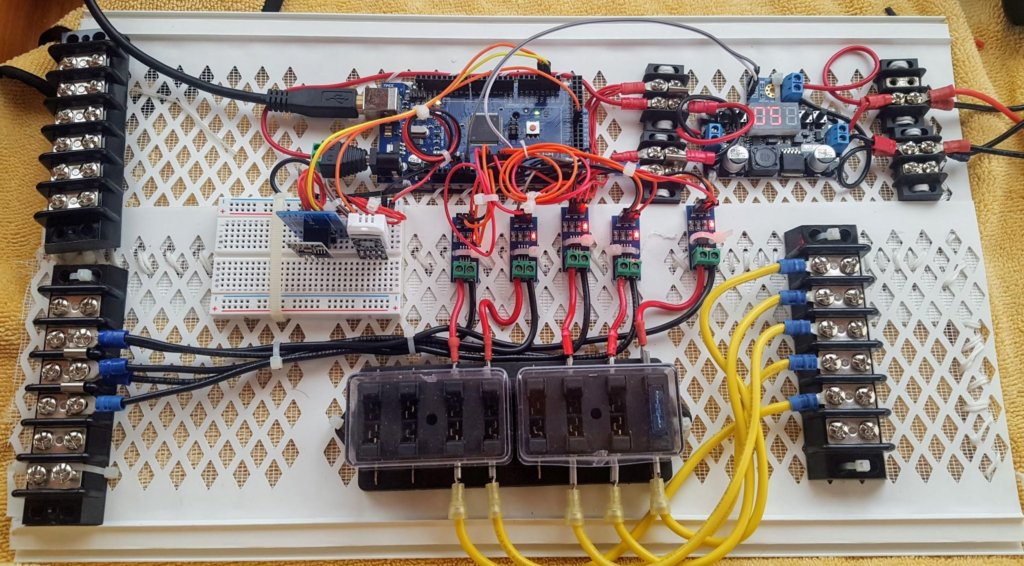
Initial Solar Sensor & Customized WilhelmSK Display
As sometimes happens on boats in the midst of this project a less fun piece of equipment failed. Our grey-water tank control gave up the ghost and died. Sadly, the only product that really met requirements was a “Tank Sentry” product in excess of $1000! My attention quickly turned to a homemade Signal-K-based system.
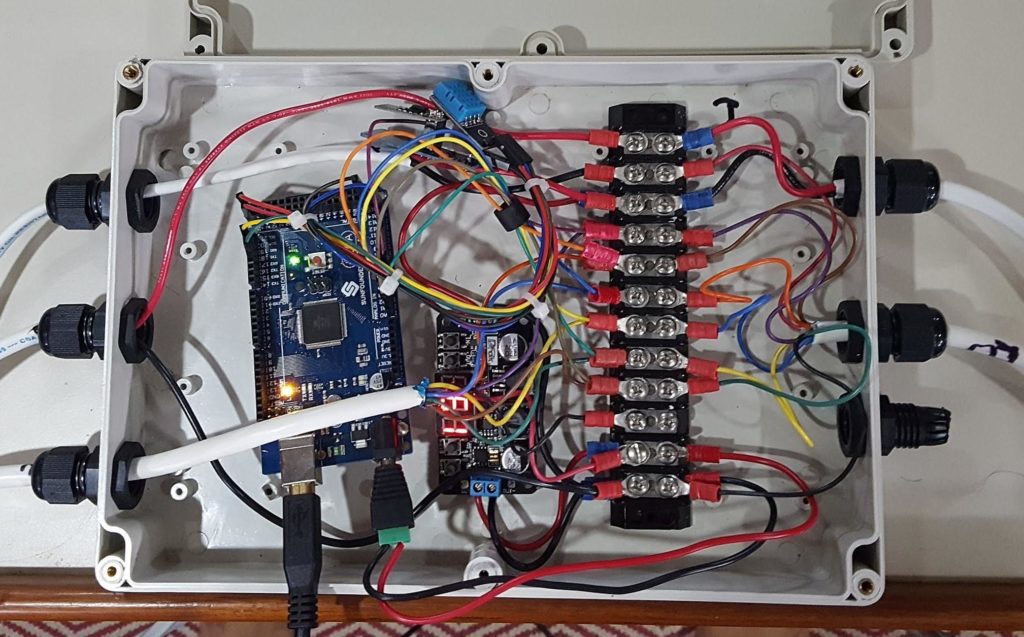
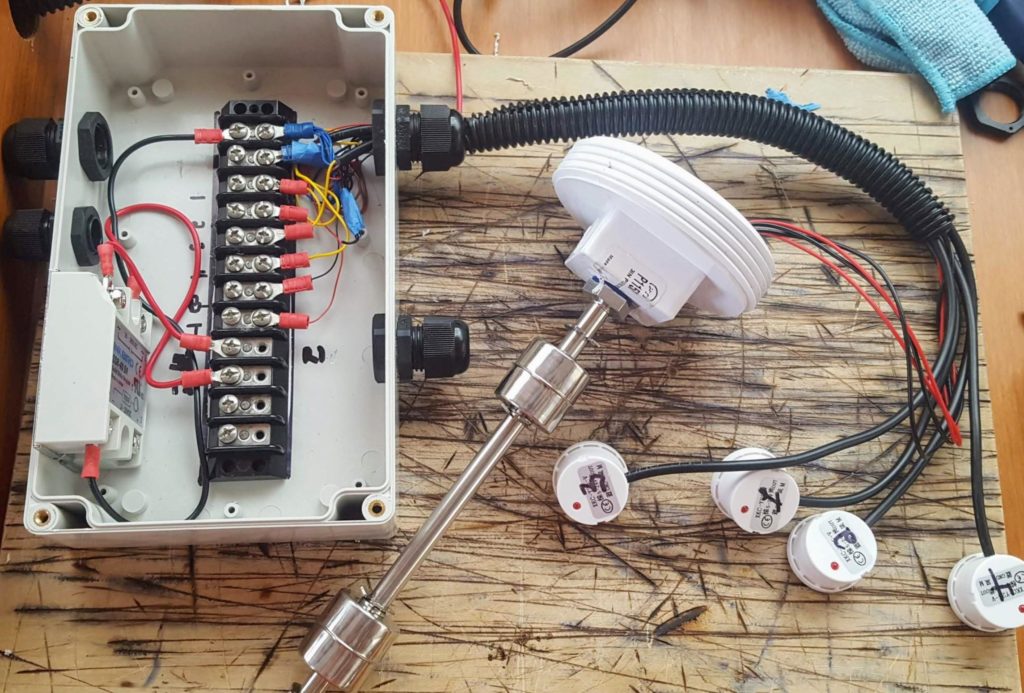
Grey-water Pump Controller & Tank Sensor Interface Cabinet
Since I had never tried anything like this before I wanted to have two isolated level sensors. I wanted to make sure we could still use the sensor if the “smart” part should fail! I started with a float switch and several Non-contact Digital Water Sensors. I eventually abandoned them and went with a second traditional resistance float switch. The control panel was made with some teak, LEDs and switches that I had on hand. An upgrade could be in the works, but waiting on inspiration for it. The Tank Sensor Control system is based on the Mega2560 controller board instead of the later adopted ESP-32 controller board.
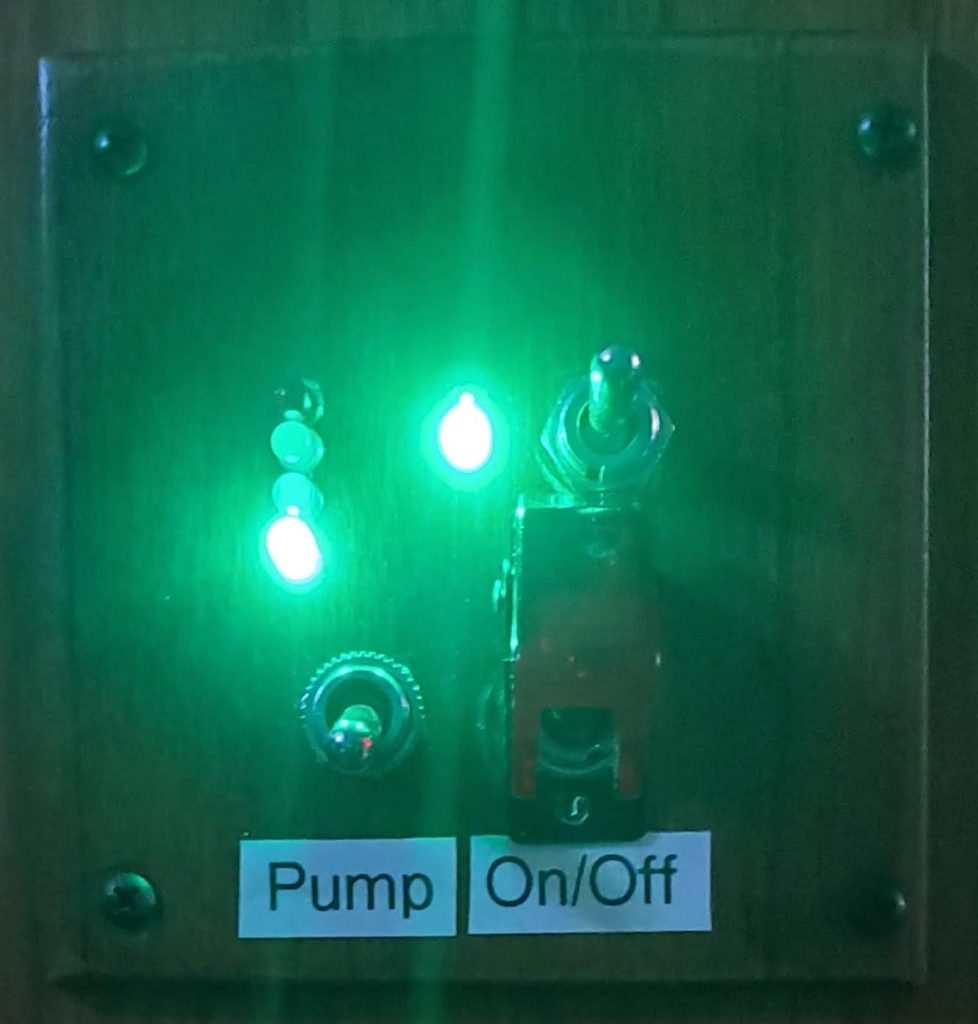
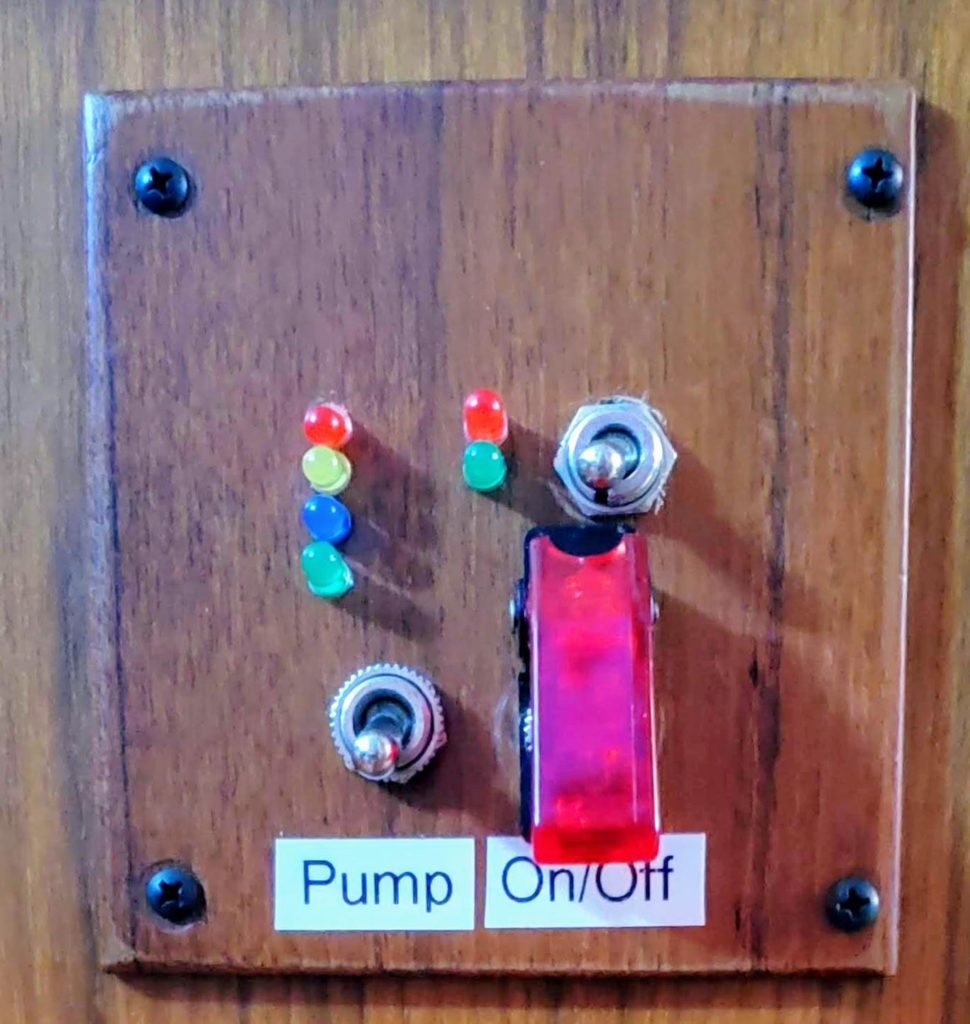
The Tank Sensor & Control measures tank level, displays the measured levels via the installed LED lights and will empty the tank either manually, or automatically under control of the Arduino controller. In addition the following data is sent to the SignalK Server via UDP over WIFI.
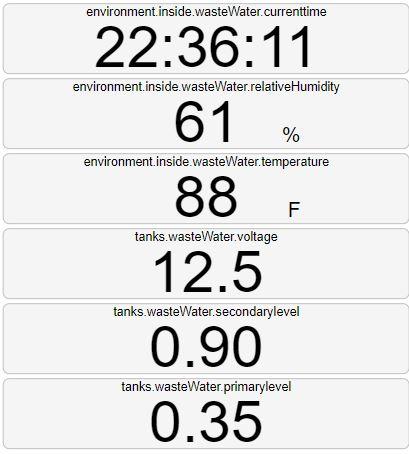
– Current time aboard the Arduino is reported. – Current humidity inside the Arduino hardware case.
– Current temperature inside the Arduino hardware case.
– Ship’s Battery Voltage
– Secondary Sensor Tank Level (Only 2 values available from this sensor, high or low)
– Primary Sensor Tank Level (4 values available from this sensor, high, high-medium, low-medium or low)
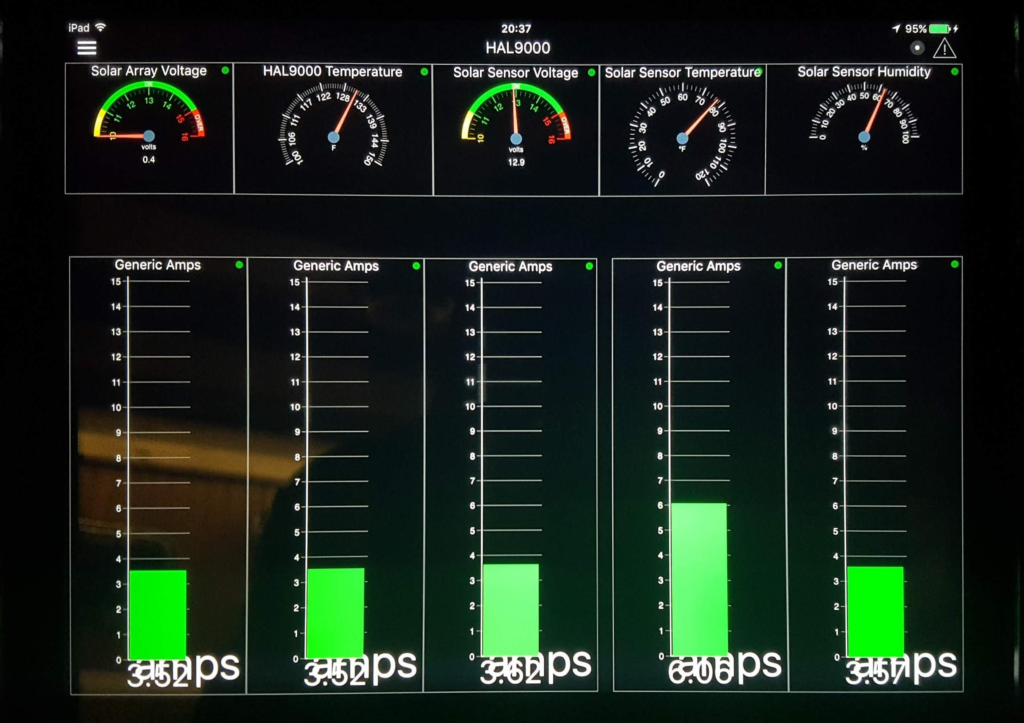
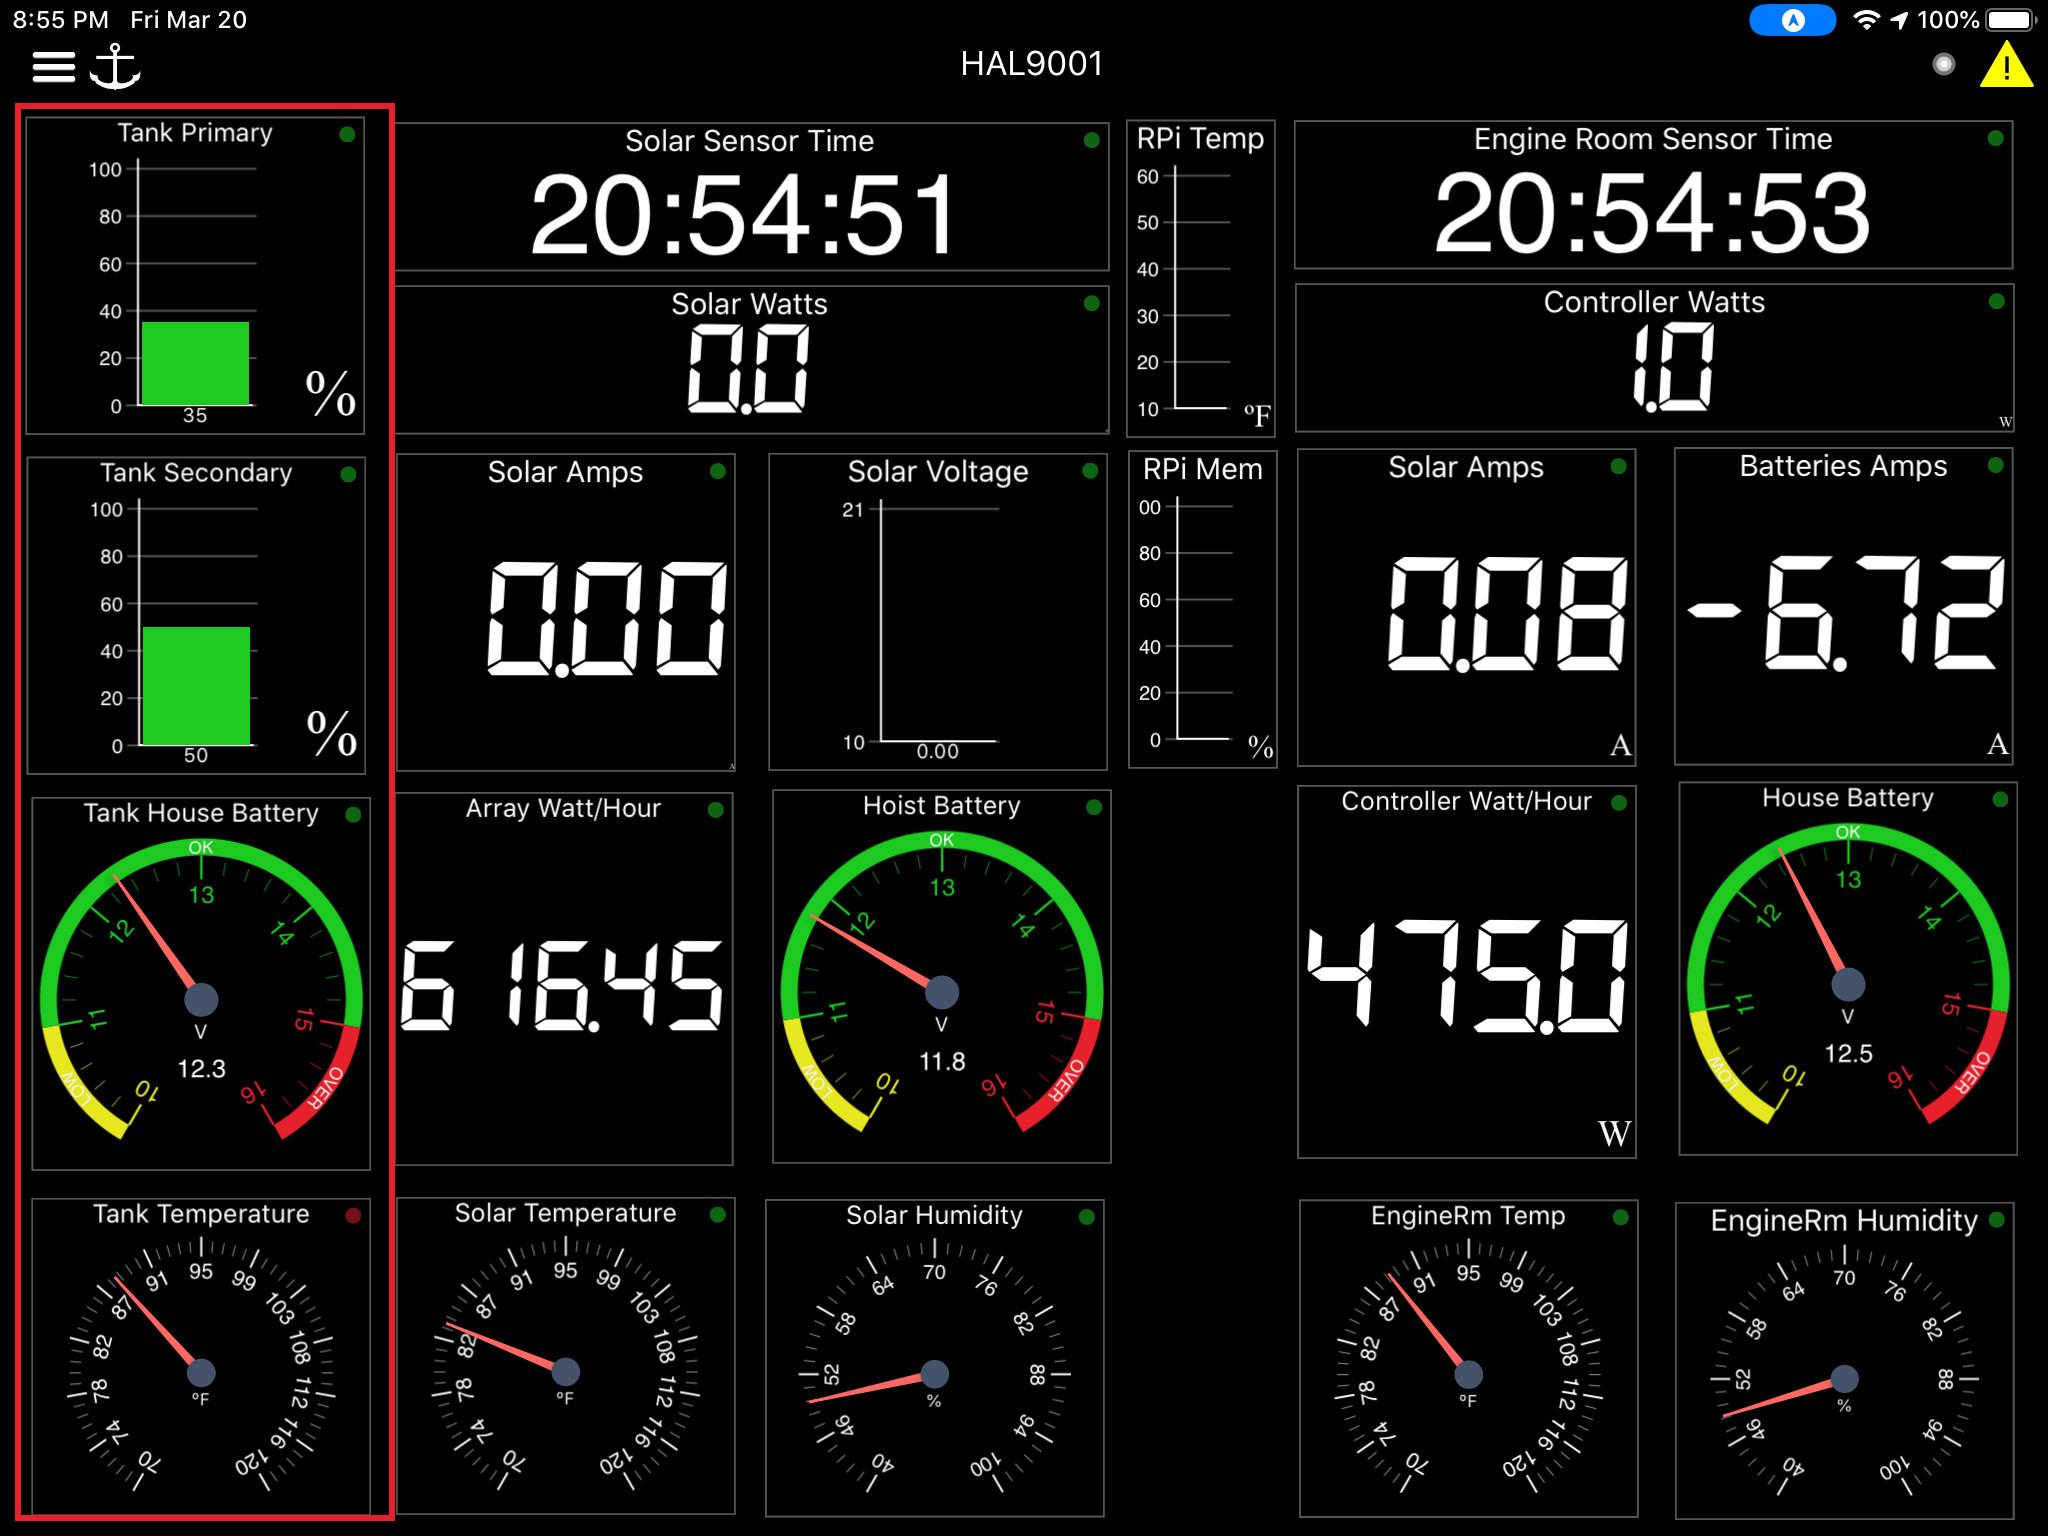
WilhelmSK is one method to display SignalK data. Note that the Grey-Water tank data is highlighted in red below.
I think that kind of explains how we got here and now I will provide a more in-depth discussion of what we have implemented aboard Magnolia.
Current Implementation:

The above diagram presents the interconnected functions of the Magnolia Data Connection System. The Signal-K Server running on a RaspberryPi is at the center of the diagram.
Raspberry Pi/Signal-K Server: The Raspberry Pi (https://en.wikipedia.org/wiki/Raspberry_Pi ) itself is a single board computer which provides the same functionality as any other computer although two extra attributes make them very desirable for this application. 1. Cost – relatively CHEAP! 2. Power – power consumption is low, powered by 12v supply. As far as computer processing power, the device provides all the capabilities required by the Signal-K server software. The Signal-K server software provides a mechanism to transfer, store, and distribute data focused on a boat environment. The Signal-K server software is best described here (http://signalk.org/overview.html).
The server receives inputs from various sources:
Actisense NGW-1 NMEA 2000 Gateway: (https://www.actisense.com/products/nmea-2000-gateway-ngw-1/ ) This commercial device interfaces the Signal-K Server to the boat’s NMEA network. Garmin, Raymarine are examples. The data transmitted can be any combination of Navigation, Depth, Wind and can include engine and other systems data.
Bilge Sensor: This is a home-built sensor is the latest addition aboard Magnolia. Its purpose is to collect the primary bilge pump run frequency and run duration. Magnolia has a traditional stuffing box and the bilge is not dry. Our bilge pumps have always popped on as required, but I never had any understanding of how long and how often. We now have that data. (ESP-32 Processor)
Battery Sensor: Another home-built sensor that collects current and voltage data associated with the house battery bank. In addition electric current data is collected from solar arrays. A standard electrical shunt device is used to collect current data coming from the Outback Solar Controller and another shunt is used to monitor total current coming and going to the house bank batteries. The sensor also includes reporting of the Battery Sensor current time, temperature and humidity as well. (ESP-32 Processor)
Tank Sensor: This sensor/controller is pretty well described above in the opening section. (Mega2560 – Processor)
Solar Sensor: This home-built sensor is very similar in functionality to the Battery Sensor. The Solar Sensor collects Solar Data coming from the Solar Arrays BEFORE it is fed into the Outback Controller. Magnolia has a battery on the fly-bridge used to power the Dinghy Hoist. This battery is charged via a separate solar panel and monitored via the Solar Sensor. (ESP-32 Processor)
The above paragraph outlines how data is collected using the various sources but how it is viewed and utilized is where the real value of these systems come into play.
WilhelmSK (https://www.wilhelmsk.com/ ) (from webpage) is a commercial highly customizable boat instrument display that uses the Signal-K protocol (signalk.org) to show information from your boat’s sensors on your iPhone, iPad, Apple Watch or AppleTV. On Magnolia we primarily use this application in the Pilothouse to display our Signal-K collected data. Essentially there are two separate displays. One is designed for Navigation Related Data and the other for Systems Status Data.
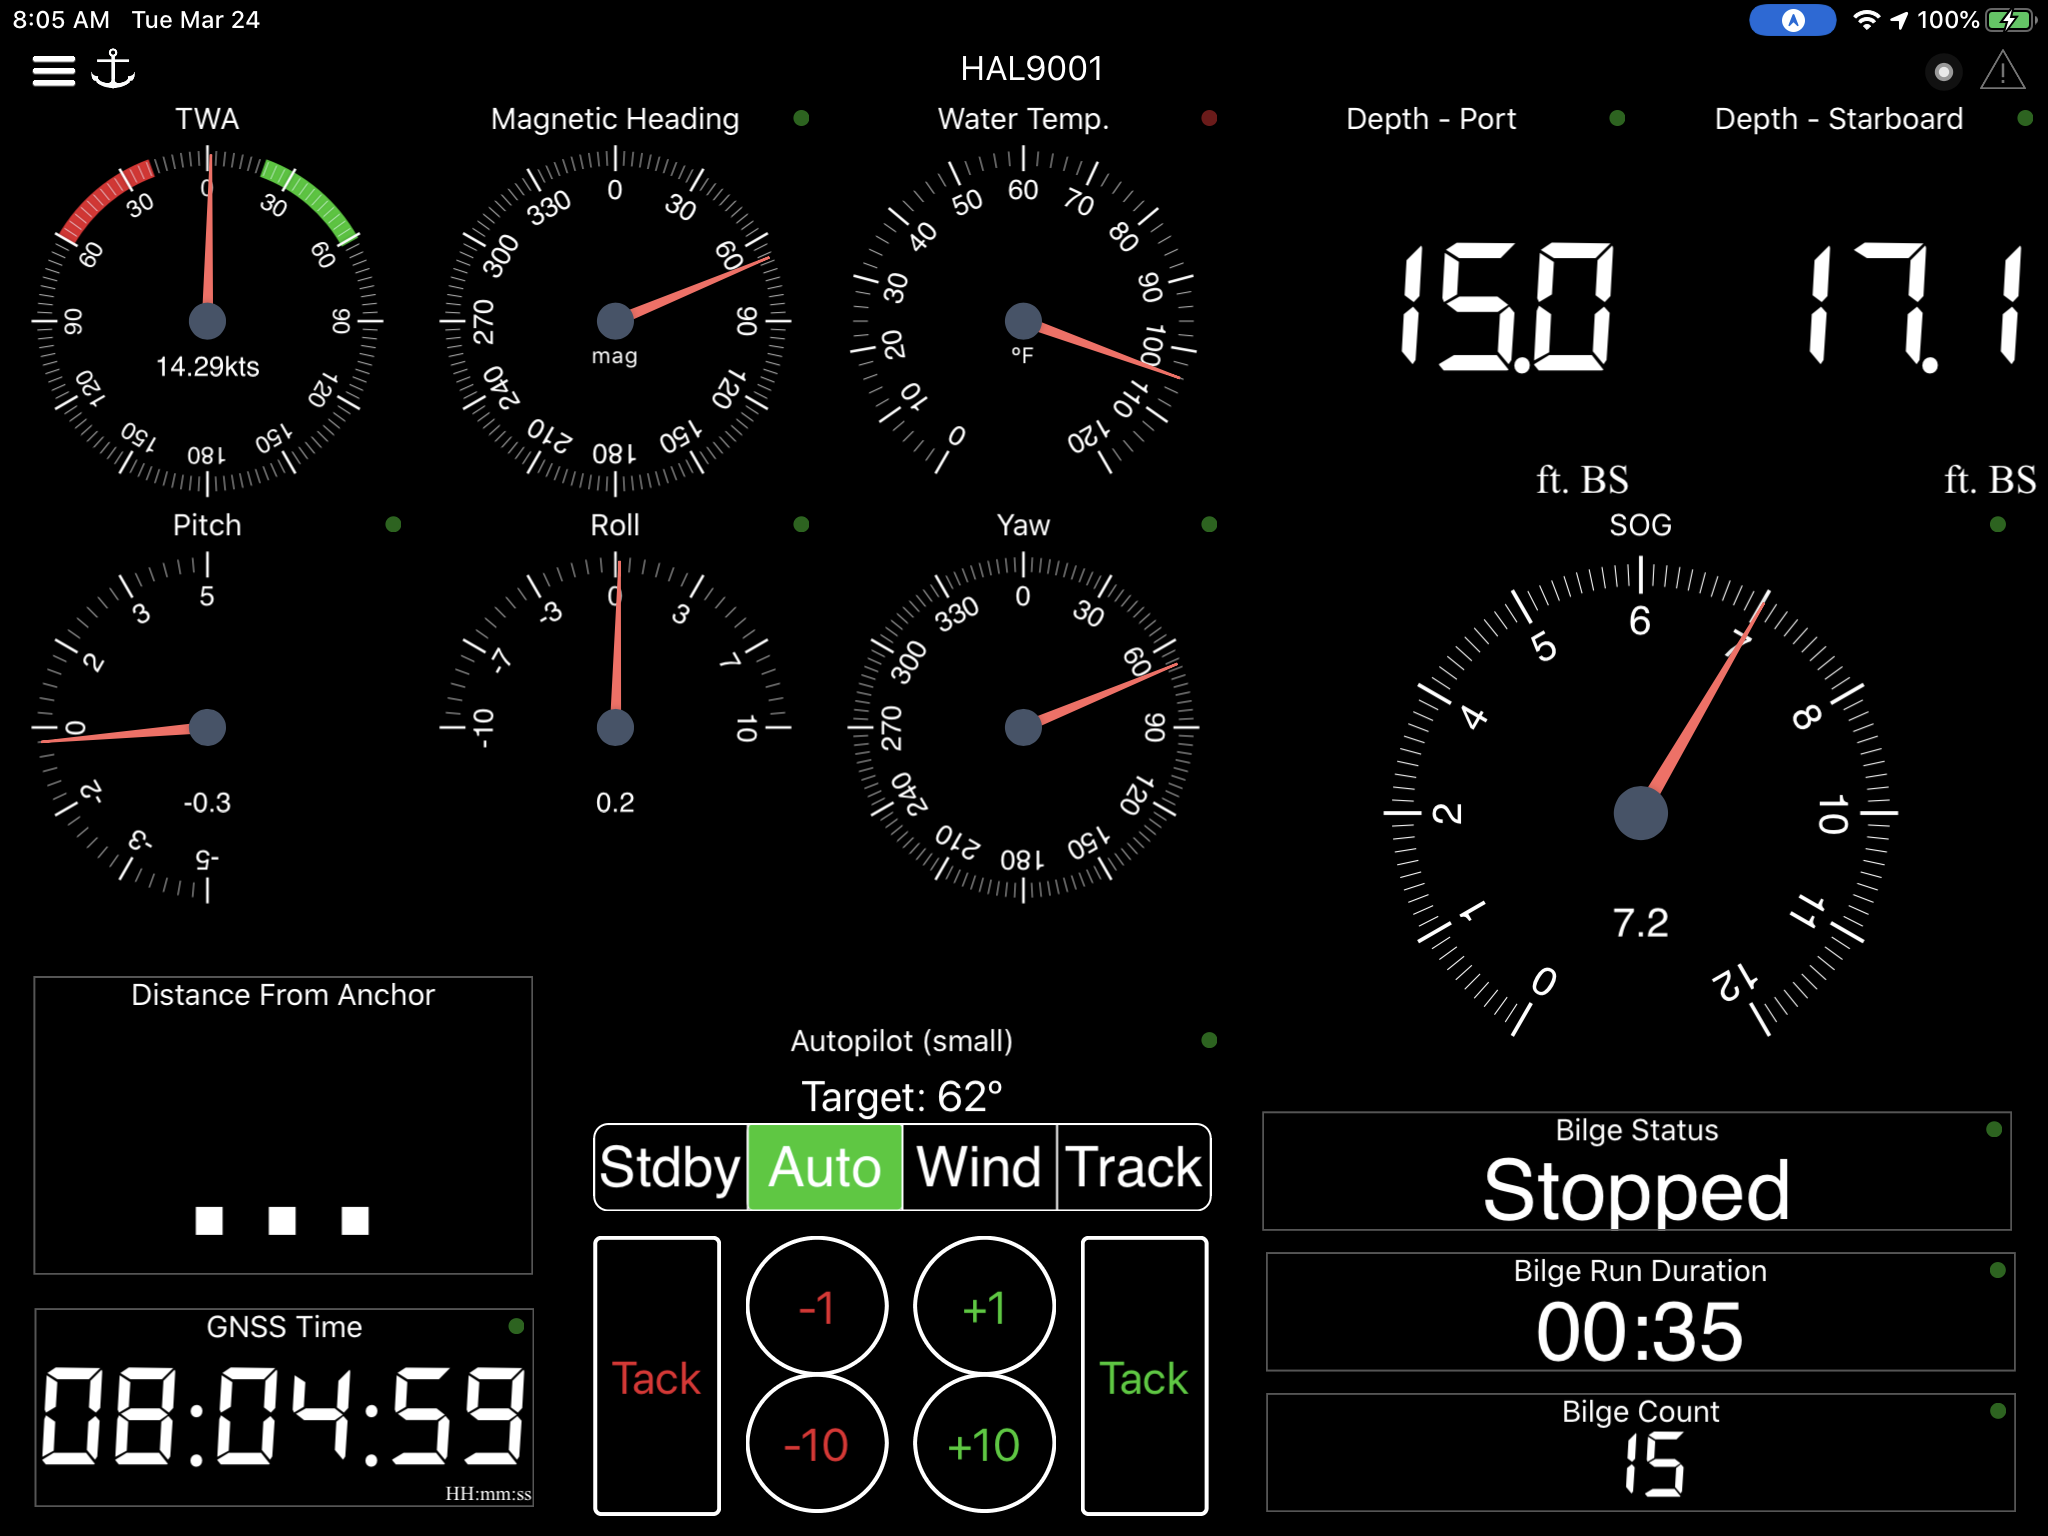
The Navigation Data Screen provides all of the usual data but a couple of items require special notice. Magnolia has two depth transducers installed (one port, the other starboard). One weakness of Raymarine is it could only use one transducer at a time. Signal-K and the WilhelmSK application allow me to display data from both transducers at the same time. In addition, unlike any display in Raymarine we are able to display Pitch, Roll and Yaw data being generated by the 6-Degree of Freedom (DOF) gyro. This display also shows the current data from the Bilge Sensor as described above. The anchor distance from the Signal-K embedded anchor alarm can be displayed as well. Last but not least on Raymarine Systems, the autopilot can also be controlled as well.
The Systems Status Data Screen is essentially where the data from Battery, Solar and Tank Sensors is displayed. As previously described the left hand side of the screen provides grey-water tank related data. There is one tank but two sensors. The granularity of the sensors is different and that is why they measure slightly differently. Everything is a compromise. The electronic tank sensor is located at the far-end of the forward 12v bus so we also report back the battery voltage measured at that location. There is also a temperature/humidity sensor and a real-time clock reported to the server as well.
The center section of the display is related to the Solar Sensor. This is solar data before it has reached the Outback Solar Controller, which is essentially raw from the panel data. The panels ideally operate at 22v and produce approximately 10amps or 225w (times 5 panels). The collected data makes it very easy to see how the panels are operating in relation to specification.
The section on the far right again is similar to the center in that it primarily shows solar data, but this data is AFTER the energy has been passed through the Outback Solar Controller. There are two electric amp displays, Solar and Battery. The Battery display is a measure of what is happening in the battery bank, i.e.are we making more energy than we are using either through solar, the generator or even the alternator. The Solar Current measures the solar panels contribution to the battery status. For example, the ship’s equipment may be using a -10amp load but if solar is producing +20amps it will appear +20 in the Solar Current Display and +10 in the Battery Current Display.

Amazon Alex – (https://www.amazon.com/Scott-Bender-Signal-K/dp/B078X362VK ) “When you connect your Signal K Node server to the Signal K cloud, you can use Alexa get information like wind speed, battery charge, tank levels, etc.” I really do not use this functionality but it makes a great parlor trick!
Grafna / Influx – I neglected to include this item from my overall chart. This section really begins to show the super strength of Signal-K and how sharp the developers of this server really are!
Influx (https://en.wikipedia.org/wiki/InfluxDB): “InfluxDB is an open-source time series database (TSDB) developed by InfluxData. It is written in Go and optimized for fast, high-availability storage and retrieval of time series data in fields such as operations monitoring, application metrics, Internet of Things sensor data, and real-time analytics. It also has support for processing data from Graphite.”
Grafna (https://en.wikipedia.org/wiki/Grafana): “Grafana is a multi-platform open source analytics and interactive visualization software available since 2014. It provides charts, graphs, and alerts for the web when connected to supported data sources. It is expandable through a plug-in system. End users can create complex monitoring dashboards[4] using interactive query builders.”
The developers of Signal-K provided a mechanism for all that boat-reported data to be stored in an Influx Database. Using a tool like Grafna, a dashboard like the simplistic one below can be created EASILY! My simplistic dashboard below shows the items I am curious about on a day to day basis. The top window tells me about the energy the solar panels have produced over the last 48 hours measured in watts (instantaneous). To the right, the next display tells me about production over the last month measured in watt-hours. The House Battery Bank Voltage is straightforward and corresponds to charging action of the solar panels from above. As I said the Bilge Pump Sensor was just recently brought on line, but as you can see it shows the number of times it turned on and the total run-time. You can see in the chart below what day Magnolia was underway. Still figuring things out here. Last but not least is the voltage of the Dinghy Hoist Battery. Its voltage too corresponds to solar charging but we do have a small charger in place to ensure the battery’s availability. Having the data available to understand trends is extremely useful.

Node-Red / MQTT – Before I started with Signal-K I had never heard of InfluxDB, Grafna nor these next two topics. The more I learn the more I am impressed with the Signal-K developers. When it comes to usefulness, this in my mind is where things go completely off the charts.
Node-Red (https://en.wikipedia.org/wiki/Node-RED): ”is a flow-based development tool for visual programming developed originally by IBM for wiring together hardware devices, APIs and online services as part of the Internet of Things.”
MQTT (MQ Telemetry Transport) (https://en.wikipedia.org/wiki/MQTT): ”is an open OASIS and ISO standard (ISO/IEC PRF 20922) lightweight, publish-subscribe network protocol that transports messages between devices. It is designed for connections with remote locations where a “small code footprint” is required or the network bandwidth is limited.”
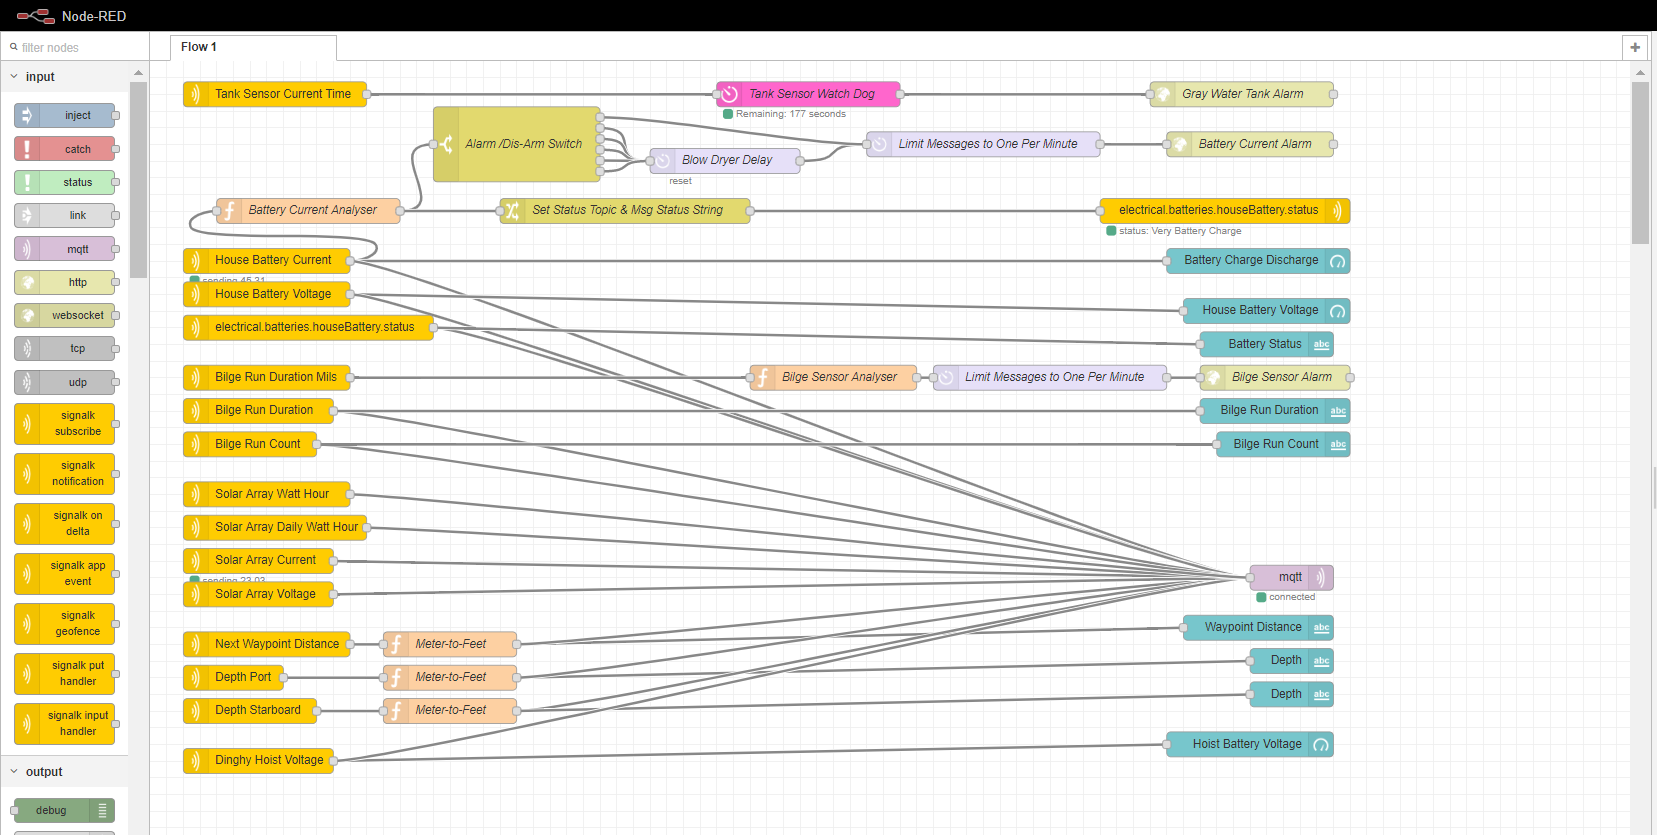
The above paragraph says a lot, but I will use the below as an example of what Magnolia is doing. On the first line of the chart below you see the Tank Sensor Current Time. This is the time message the Grey-Water Sensor sends to the server. When the server receives the time message the server sees that Node-Red has subscribed to that message and it enters my custom processing flow. Inside the flow that message is used to reset a watch-dog timer. That means that if the message is not received in the prescribed three minutes the flow automatically sends a message to the Grey-Water Tank Alarm which plays an audio message that starts with an alarm and then a message saying “Grey-Water Sensor Appears Offline.” In addition a SMS Text Message is sent to my phone. Thanks to Jeff Siegel who opened my eyes to another technology, PHP web scripting, which makes this functionality possible! Having that alarm go off sure beats a grey-water tank from overflowing into the bilge! The possibilities are endless. I might point out the “Blow Dryer Delay” implemented in the Battery Current. The purpose of this processing is to send an alarm if, for example, a high current appliance is left turned on or if shore power is lost and the air-conditioner is on. Obviously the alarm is not allowed to go off while the blower dryer is running…btw, that is an agreed on five minute timer! 🙂
There is similar processing throughout the flow, but the smallest box on the flow is the most powerful. The lavender box marked “mqtt” is the coolest. That little box collects data sent to it and forwards that data to a MQTT broker that lives out on the internet and allows that data to be forwarded to my phone. As previously shown, alarm SMS Texts can be sent, but in addition, actual data can be forwarded to my phone as well.
The phone screen captures below allow me to see what is going on aboard Magnolia from any place in the world. We can see: status of the batteries, solar, how far we are from the anchor drop location and how deep the water is! Essentially any data on the boat is available anywhere in the world. For me this was the ultimate endpoint.


Cost: In dollars this technology is essentially free. All of the software is free (WilhelmSK is $19.99 and worth hundreds!) and the hardware I have purchased is less than $250. The cost in hours is immeasurable, but the satisfaction is priceless.
Thanks: The development team at Signal-K are rock stars! The product they are producing is amazing, the choices they have made and implemented provide the flexibility to do anything we boat geeks can imagine. Special thanks to Scott Bender and Teppo Kurki who patiently helped me through many technical challenges. I cannot forget to thank my friend, Jeff Siegel, who is always willing to talk through ideas and implementations.
Dedication: This post is dedicated to all the people and teams I have been blessed to be part of over this lifetime. The list is too long to enumerate but it started with Cam-Bake Productions and a stupid little casino game aboard this Navy Ship. What a freaking adventure!